
Data Engineering & Business Intelligence
Connect operational data, agree the meaning of your metrics and build reports your team can trace back to their sources.
Free first conversation. Written scope and price before work begins.
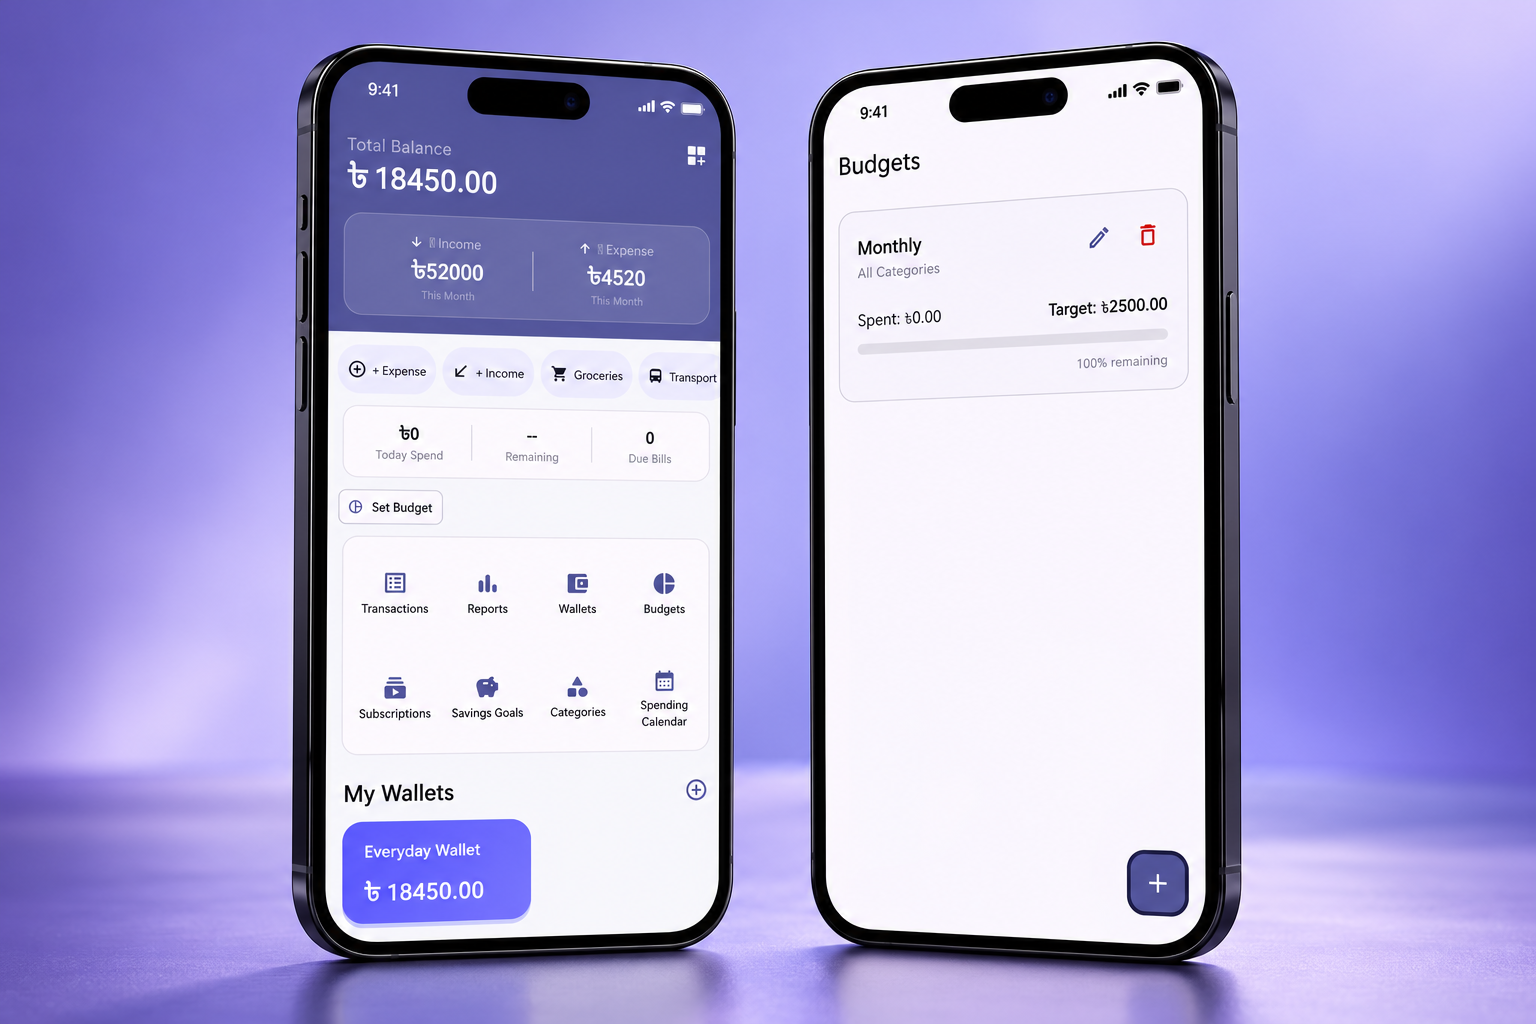 Explore the work: Expense Tracker Offline Personal Finance App →
Is this the right next step?
A practical guide to fit, first scope and the decisions to make before committing.
Who this is for
Teams reconciling spreadsheets, repeating manual reports or seeing conflicting numbers across sales, finance and operations.
Your first milestone
Choose one business question, inspect its source data and agree metric definitions. Validate a focused report before adding more dashboards.
What affects cost and timing
Source-system access, data quality, refresh frequency and reporting licences affect the scope. Historical cleanup and new integrations are priced explicitly.
Built around your business.
Know what is included.
- Data source mapping and reporting requirement analysis
- Data cleaning and pipeline design
- Dashboard and KPI design
- BI implementation and automated reporting
- Documentation and handover support
Your proposal confirms the scope, integrations, responsibilities and support included in your project.

- 1
Identify reporting goals and source systems
- 2
Define data model, metrics, and ownership
- 3
Implement pipelines, dashboards, and validation
- 4
Train teams and improve iteratively
Begin with the decision the report needs to support.
Share a sample report, the systems behind it and a decision your team struggles to make. We map the sources, definitions and checks needed to produce a useful view.
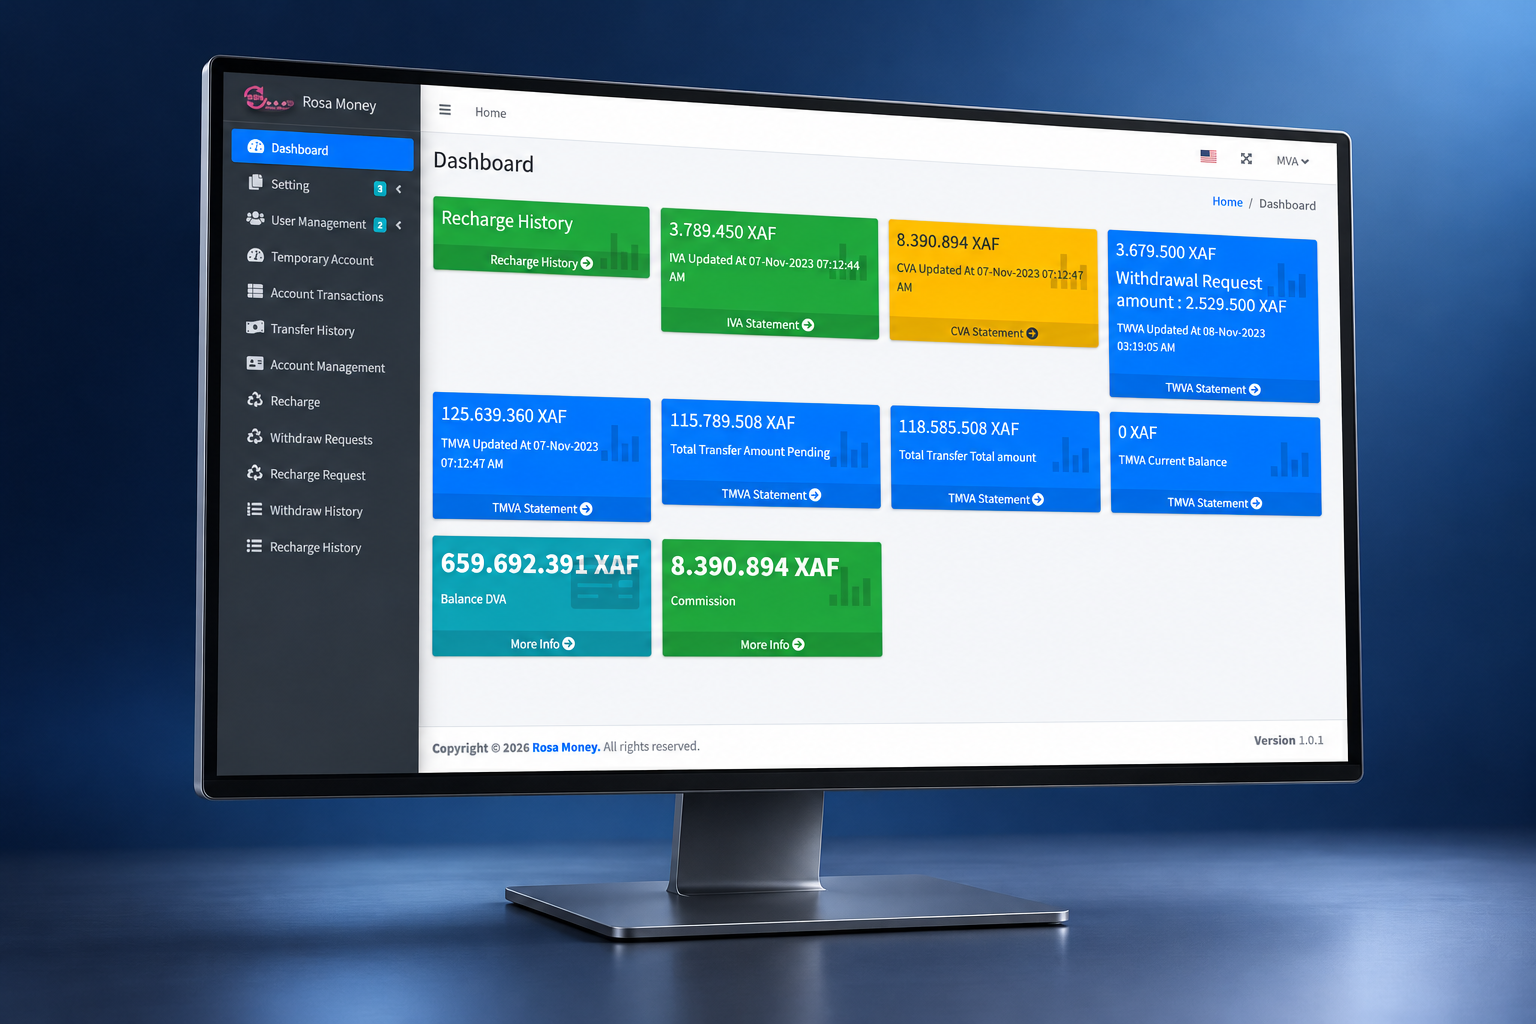
The handover should explain refresh timing, metric ownership, known data gaps and how totals are validated. View the RSM operational workspace for an example of connected business records.
Before you start
If you need something more specific, our team can talk through your use case directly.
Talk through your Data Engineering & Business Intelligence brief.
Share the problem, your current setup and the outcome you need. We will agree a useful next step.